| |
A unified graphical debugging environment
Key Benefits
• “Walks up” to any running simulation for interactive debugging
• Offers interactive and/or post-process debug supporting OOP/AOP class-based
debug environments
A unified graphical debugging environment within Cadence® Incisive® Enterprise Simulator, Cadence
SimVision™ Debug supports signal-level and transaction-based flows across all IEEE-standard design,
testbench, and assertion languages. It also supports concurrent visualization of hardware, software, and
analog domains.
SimVision Debug can be used to debug digital, analog, or mixed-signal designs written in Verilog,
SystemVerilog, e, VHDL, and SystemC® languages or a combination thereof. SimVision integrated
debug supports signal-level and transaction-based flows across all IEEE-standard design, testbench,
and assertion languages, in addition to concurrent visualization of hardware, software, and analog
domains.
SimVision Debug provides a unified simulation and debug environment that allows Incisive Enterprise
Simulator to manage multiple simulation runs easily and to analyze both design and testbench behavior
at any point in the verification process—regardless of the composition.
Throughout the design and verification flows, SimVision Debug provides source browsing, transaction
and mixed-signal waveform analysis, complete code/transaction/ assertion coverage analysis, integrated
display and debug of power behaviors, hardware analysis checks, and seamless connections to downstream
implementation flows. APIs based on industry standards are available at all levels to enable user-defined
checks and analysis. Design and testbench models can be interleaved in any language and any level of
abstraction without the performance and integration overhead caused by co-simulation.
SimVision Debug comprises several analysis windows to address debug complexity. Some of these windows
(available as toolbar buttons and menu choices) include:
• The Properties window, which lets you manage the cursors, markers, expressions, and other debugging
objects that you have created during your SimVision Debug session
• The Design Browser window, which lets you monitor the signals and variables in the design
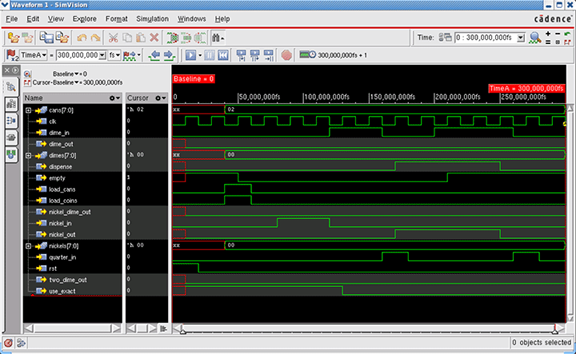
• The Waveform window, which plots simulation data along an X and a Y axis. Data is usually shown as
signal values versus time, but it can be any recorded data.
• The Source Browser, which gives you access to the design source code
• The Schematic Tracer, which displays a design as a schematic diagram and lets you trace a signal through
the design
• The Memory Viewer, which lets you observe changes in the internal state of memory locations. During
simulation, it also lets you set breakpoints, and force and deposit values to memory locations.
• The Watch window, which lets you monitor selected signals and variables in the design in a more
concise form than the Design Browser
• The Register window, which lets you use a free-form graphics editor to define any number of register
pages, each containing a custom view of the simulation data
• The Expression Calculator, which lets you define expressions, which combine signals to form buses,
conditions, and virtual signals.
|
| Graphical view of SimVision window |
|
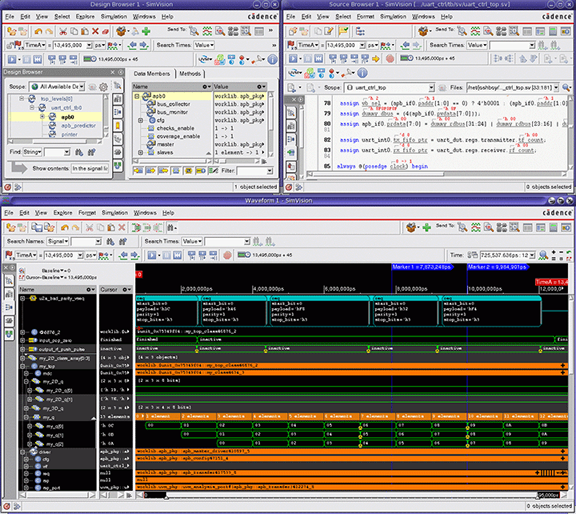
SimVision Debug waveform window synchronized with the Design Browser and
Source Browser windows |
|
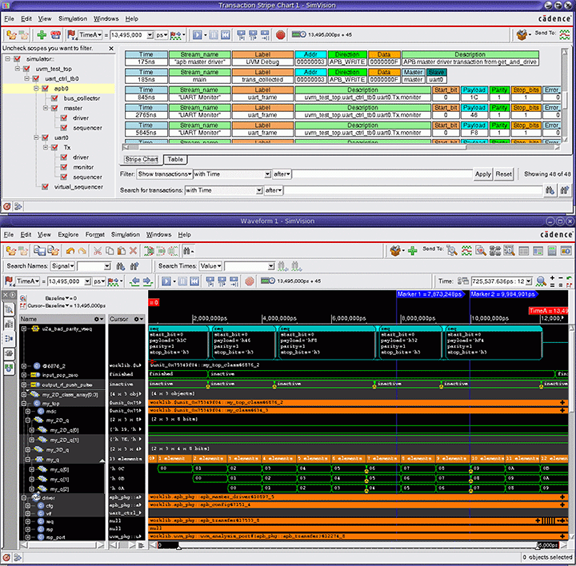
SimVision Debug displaying transactions in the waveform window synchronized with
the Transaction Stripe Chart window |
Unique Features of SimVision
• Multi-language, mixed-signal support: SimVision Debug supports all IEEE and Accellera standards
for digital, analog, or mixed-languages (Verilog, SystemVerilog, e, VHDL, SystemC/C/C++, or a
combination). You can leverage SimVision Debug from the Virtuoso and/or Incisive environment.
Analog and mixed-level behavioral abstractions of wreal, SystemVerilog reals, Verilog-AMS, and
Verilog/VHDL are also supported.
• Walk-up connections: SimVision Debug can “walk up” to any running simulation, allow you to
interactively debug, and then detach from it to continue the simulation.
• e/SystemVerilog class-based debug: SimVision Debug offers interactive and/or post-process debug
that supports OOP/AOP class-based debug environments. It supports full Logical Path Name as well as
unique class object handles (direct handle to object in memory). SimVision Debug also provides many
innovative visualization capabilities to debug dynamic data in post-processing mode.
• UVM awareness: Since the Universal Verification Methodology (UVM) defines class-based, transaction-
driven testbenches, you need a debug environment centered on these elements. SimVision Debug
enables you to access the environment through both the class inheritance and the instance trees. You
can follow the simulation flow single-stepping through/over lines, method calls, and even into macros.
• Transaction analysis: If the testbench uses transaction recording, debug becomes even easier. UVM
provides automatic transaction recording so that you can view your test sequences. SimVision Debug
adds a novel stripe chart view that allows you to visualize the sequential order of transactions across
multiple streams.
• Macro debug: SimVision Debug simplifies UVM debug by giving you visibility into expanded macro
code, in-line with your source code while retaining original formatting. It also identifies nested macros,
expands/collapses macros, and debugs annotated values for all macro variables.
|