| |
Improves debug productivity by up to 50%
Key Benefits
• Facilitates up to 50% faster detection of the underlying bug source
• Applies advanced data exploration techniques to hardware verification
for faster debug to root cause
Helping you increase your verification productivity, the Indago™ Debug Platform uses modern and
innovative debug concepts such as patented, automated root-cause analysis (RCA), and advanced
data exploration techniques. Using the platform, you can uncover bugs up to 50% faster than with
traditional, sample-based debug approaches. The platform further expands the comprehensive
Cadence® Verification Suite, which accelerates system design and verification via a set of open,
connected, and scalable platforms.
 |
| The Indago Debug Platform can help you uncover bugs up to 50% faster. |
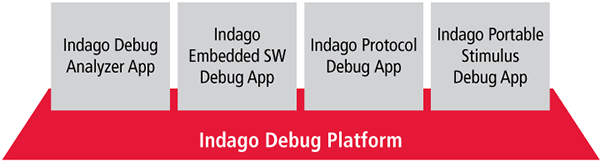
The Indago Debug Platform is integrated and open, enabling multiple design and verification specialists
to operate as a team to resolve SoC bugs. The four debug apps currently built into this platform include:
• Indago Debug Analyzer App provides RTL, gate-level (GL), and testbench debug, and offers RCA for
both (IEEE 1647) and SystemVerilog (IEEE 1800) testbench and for RTL/GL. The Indago Debug Analyzer
App provides post-process debug capabilities in an intuitive, modern, multi-threaded debug environment.
• Indago Embedded Software Debug App, which synchronizes software and hardware source code debug
to resolve bugs associated with embedded software applications. This app is optimized for the Cadence
Xcelium™ Parallel Simulator and the Cadence Palladium® Z1 Enterprise Emulation Platform.
• Indago Protocol Debug App, which provides intuitive debugging by using Cadence verification IP (VIP)
to visualize advanced protocols such as DDR4, LPDDR4, DIMM, ARM® AMBA® AXI, ARM AMBA ACE, ARM
AMBA CHI, MIPI® CSI-2, DSI, DisplayPort, USB3, Ethernet, PCI Express® (PCIe®) Gen 2 and 3.
• Indago Portable Stimulus Debug App, which leverages the easy-to-read UML activity diagrams used in
the Cadence Perspec™ System Verifier to help streamline finding and debugging issues found via portable
stimulus.
Breaking Through the Verification Bottleneck
Debug has long been considered a verification bottleneck. You can spend dozens of cycles making
educated guesses about where to sample data and rerunning verification based on observed errors.
Most debug processes still involve printf() statements and waveforms. What’s more, with increasing
SoC complexity comes more complex debug.
Current debug methodologies call for multiple simulation iterations that incrementally extract data points
to ultimately pinpoint the source of the bug. This can be a very long and frustrating process, forcing you
to spend valuable engineering time rerunning the verification engine, incrementally adding data probes
and print statements, and reviewing virtually the same mountain of data again and again.
Indago Debug Platform provides a significant shift in debug methodology. To identify the root cause of the
bug, the Indago Debug Platform applies advanced data exploration techniques, which allows you to sample
not just a subset, but the entire debug data set (messages, waveforms, source execution order, call stack,
active threads, etc.). You can single-step forward or backward to replay the simulation result at each point
in the RCA process. All of this is possible in post process, without consuming a simulator license. You can
analyze and play back the data, asking deeper questions about what really happened during the run, without
rerunning simulation. The automation in the platform can highlight causality and point out correlations that
would otherwise go unnoticed through a traditional approach.
As the Indago Debug Platform records the complete execution order of your source code, you can examine
the complete call stack, active threads, and local variable values. Using the platform’s powerful RCA
automation, you can better understand the complete failure scenario and diagnose bugs much more quickly
than with the traditional approach.
|