| |
Designed to break down the verification bottleneck
Key Benefits
• Uses powerful algorithms to analyze each debug point as you navigate through your
design
• Identifies causal relationships for the most typical debug questions
• Allows you to dive into the testbench or RTL code to quickly diagnose the root cause of
a failure
• Allows you to retrace/replay interesting scenarios
Bugs are hard enough to find in a complex design, whether you're debugging at the HDL level, the testbench
level, or the verification intellectual property (VIP) level. Bugs often appear as errors dozens or hundreds of
cycles separated from their actual occurrence. With these challenges, design and verification engineers need
sophisticated tools to find bugs in the haystack of data produced by the simulator.
Through the Cadence® Indago™ technologies, you'll find sophisticated solutions to address RTL, testbench,
VIP, and SoC verification debug needs. Our Indago Debug Platform can improve your debug productivity by
up to 50%, applying advanced data exploration techniques to hardware verification for smart debug and
increased automation.
Designed to break down the verification bottleneck that exists in traditional debug flows (see Figure 1), the
Indago Debug Analyzer App was developed with sophisticated debug technologies such as automated root-case
analysis (RCA) and advanced data exploration techniques. The app, integrated into our Indago Debug Platform,
is suited for testbench and RTL debug and helps you uncover bugs 50% faster than with traditional sample-
based debug methodologies.
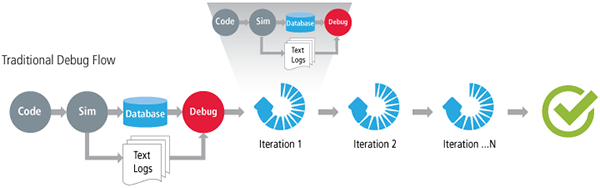 |
| Figure 1. A traditional debug flow involves several debug iterations to collect more data |
Advanced data exploration techniques involve a passive collection of a complete set of data points for powerful
and detailed analysis at a very low cost. Using these techniques along with analysis and powerful algorithms,
the Indago Debug Analyzer App, as shown in Figure 2, analyzes each debug point as you navigate your design
(messages, waveforms, source execution order, call stack, active threads, etc.). At each point, the app
identifies causal relationships for the most typical debug questions, which are presented to you in an
intuitive RCA GUI component. Using the RCA component, you can intuitively click your way through the
complete failure scenario, seamlessly diving into the testbench or RTL code to quickly diagnose the root
cause of the failure. To ensure that you can retrace your debug steps, each debug decision taken in the
RCA component is saved in an investigation tree.
Advanced data exploration techniques involve a passive collection of a complete set of data points for powerful
and detailed analysis at a very low cost. Using these techniques along with analysis and powerful algorithms,
the Indago Debug Analyzer App, as shown in Figure 2, analyzes each debug point as you navigate your design
(messages, waveforms, source execution order, call stack, active threads, etc.). At each point, the app
identifies causal relationships for the most typical debug questions, which are presented to you in an intuitive
RCA GUI component. Using the RCA component, you can intuitively click your way through the complete
failure scenario, seamlessly diving into the testbench or RTL code to quickly diagnose the root cause of the
failure. To ensure that you can retrace your debug steps, each debug decision taken in the RCA component
is saved in an investigation tree.
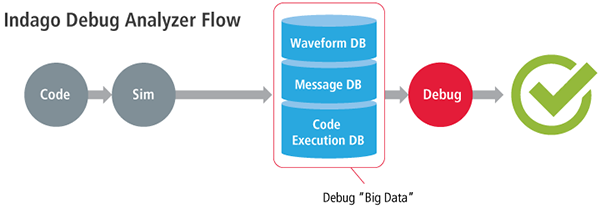 |
Figure 2. Advanced data exploration flow records complete data set for entire simulation run,
not just waves |
How the App Works, Step by Step
As shown in Figure 3, when you initially launch the Indago Debug Analyzer App, its GUI opens to display
SmartLog, an interactive log analysis tool that is hyperlinked back to the source code. The GUI opens with
the first error already highlighted, so you can start debugging right away. The source browser displays the
error message and allows you to step forward/backward through the recorded data to “play back” the bug
scenario from any point that you find interesting.
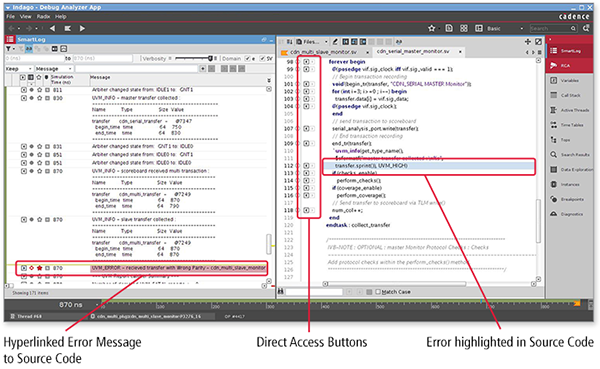 |
| Figure 3. Indago Debug Analyzer App opens with the error highlighted, so you can debug immediately. |
By analyzing the recorded debug data collected, the Indago Debug Analyzer App can provide a list of causal
relationships that answer the most common debug questions, as shown in Figure 4. The intuitive, flow-
oriented debug environment helps you determine where to look to debug. You'll get guided questions and
answers from the GUI to help you debug the error.
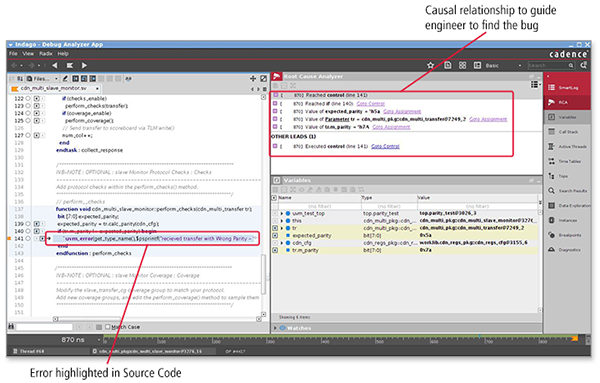 |
Figure 4. Indago Debug Analyzer provides you with causal relationships to allow you to quickly get to
the root cause of any issue within a few clicks. |
|